Beginning of Course Survey
Click on this LINK to take the beginning of course survey.
Accuplacer Practice Questions/Resources
The Accuplacer is the placement exam the Montana University System uses to place students in classes and assign dual credit eligibility to high school students. The Accuplacer is one exam but it can have multiple stages or levels (QAS and AAF, noted below).
When you call the Helena College (406-447-6939) to schedule your testing appointment, inform them it is for Math 121 College Algebra or Stat 216. All other Helena College Accuplacer questions can be answered on their website.
In order to take Math 121 - College Algebra for dual credit you need one of the following:
In order to take Stat 216 - Intro to Statistics for dual credit you need one of the following (if you did not take College Algebra for dual credit):
To help prepare for the Accuplacer, there are a number of resources shared below. We will use a few in class and some of the others you can try on your own outside of class.
When you call the Helena College (406-447-6939) to schedule your testing appointment, inform them it is for Math 121 College Algebra or Stat 216. All other Helena College Accuplacer questions can be answered on their website.
In order to take Math 121 - College Algebra for dual credit you need one of the following:
- 23 on the ACT Math
- 530 on the SAT Math
- 263 or above on the Quantitative Reasoning, Algebra & Stats portion (QAS) and 250 or higher on the Adv Alg Functions (AAF) portion of the Accuplacer
In order to take Stat 216 - Intro to Statistics for dual credit you need one of the following (if you did not take College Algebra for dual credit):
- 25 on the ACT Math
- 570 on the SAT Math
- 263 or above on the Quantitative Reasoning, Algebra & Stats portion (QAS) and 263 or higher on the Adv Alg Functions (AAF) portion of the Accuplacer
To help prepare for the Accuplacer, there are a number of resources shared below. We will use a few in class and some of the others you can try on your own outside of class.
Inside of Class Resources for QAS Portion (Need a 263 or higher)
What is on the Quantitative Reasoning, Algebra & Stats portion (QAS) portion that you need to score a 263 or higher?
| QASPortion.pdf |
In-Class Practice Questions for the QAS Portion
| QAS Practice Questions In-Class.pdf |
Answers for In-Class Practice Questions for the QAS Portion
| quantitative_reasoning_algebra_and_statistics_answers.pdf |
| qas_questions_answers_and_explanations.pdf |
Inside of Class Resources for the AAF Portion (Need a 250 or higher)
What is on the Advanced Algebra and Functions portion (AAF) portion that you need to score a 250 or higher?
| AAFPortion.pdf |
In-Class Practice Questions for the AAF Portion
| Advanced Algebra and Functions Practice Questions.pdf |
Answers for In-Class Practice Questions for the AAF Portion
| advanced_algebra_and_functions_answers.pdf |
| aaf_questions_answers_and_explanations.pdf |
Outside of Class Resources
*These are from the older "Classic" Accuplacer, but the math practice is still appropriate
Elementary Algebra Practice Test Online: http://www.accuplacerpracticetest.com/accuplacer-elementary-algebra-practice-test/
College Level Math Practice Test Online: http://www.accuplacerpracticetest.com/accuplacer-college-level-math-practice-test/
Classic Accuplacer Review of Math Concepts: https://www.mometrix.com/academy/accuplacer-math/
Classic Accuplacer Math Practice Test: https://www.mometrix.com/academy/accuplacer-math-practice-test/
Real Statistics and Case Studies Write-Ups
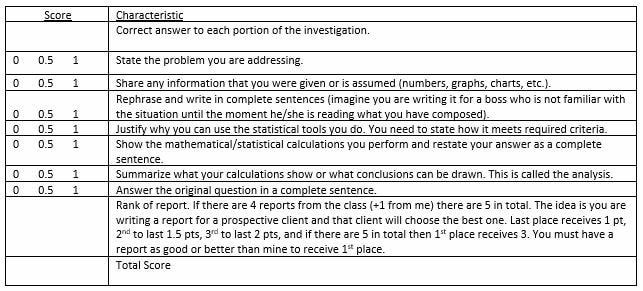
Characteristics of Using Statistics In Real Life
You need to:
You need to:
- state the problem you are addressing.
- share any information that you were given or is assumed (numbers, graphs, charts, etc.).
- rephrase and write in complete sentences (imagine you are writing it for a boss who is not familiar with the situation until the moment he/she is reading what you have composed).
- justify why you can use the statistical tools you do. You need to state how it meets required criteria.
- show the mathematical/statistical calculations you perform and restate your answer as a complete sentence.
- summarize what your calculations show or what conclusions can be drawn. This is called the analysis.
- answer the original question in a complete sentence.
| real_statistics_example_from_chapter_2.pdf |
Rubric for Grading These
Student Survey Regarding the Flipped Classroom
Please take a few minutes to provide some thoughts regarding the flipped classroom style that we utilized last unit. The link to the survey can be found HERE.
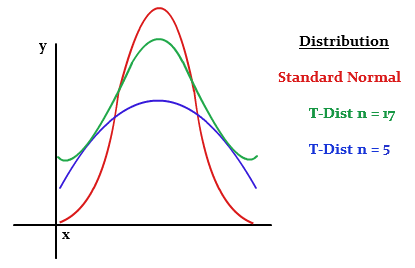
Article: William Gosset and the t-distribution

Follow along as we read the article below. When we are done, you can work together with others to respond to the reading quiz at the Google form below.
Article |
|
INTRODUCTION TO HYPOTHESIS TESTING VIDEO
(for after completing the gender bias investigation)
Watch the video below, then respond to the questions. I have about 4 or 5 headphones to borrow in class below the calculators, otherwise use your own or turn on subtitles by clicking on the CC button in the lower right portion of the video.
1) What was Sam's null hypothesis?
2) What score did the presenter state would be unusual (you wouldn't believe Sam) and what score would not be unusual (you would believe Sam)?
3) What was the cutoff score the presenter shared for believing or not believing Sam? If Sam's 3-game average is below that score, what would the conclusion be?
4) In the scenario of bowling with your mother, if you want to be more sure that your mom's claim is false before calling her a liar, what can you do?
5) What happens to the area of the rejection region when you lower the cutoff score?
6) How do you think the rejection regions would compare between a medical study and a study concerning testing claimed mini golf scores of your friends? Explain.
7) What was the sample statistic in Sam's case? What was the critical value in Sam's case?
8) If you want to be more sure (we say "confident" in statistics) when rejecting the null, should you use a larger or smaller significance level?
Typing Up a Response to a Real-World Situation: Air Pollution
In this investigation, we are going to look into PM, which stands for "particulate matter (also called particle pollution): the term for a mixture of solid particles and liquid droplets found in the air. Some particles, such as dust, dirt, soot, or smoke, are large or dark enough to be seen with the naked eye. Others are so small they can only be detected using an electron microscope," (EPA website). To begin, inform yourself about PM by reading the brief article found below. Note, we will be working with PM 2.5.
https://www.epa.gov/pm-pollution/particulate-matter-pm-basics
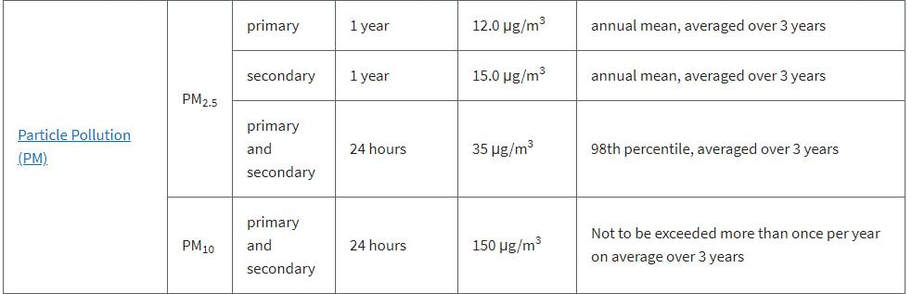
I have used the Center for Disease Control's database to collect the average monthly PM2.5 level for each state from 2008 - 2011 (so, 48 months). Each of you are to choose a state and conduct a hypothesis test on the state's claim that they are meeting the Clean Air Act from 1990, which requires the EPA to set National Ambient Air Quality Standards for pollutants considered harmful to public health and the environment. Inform yourself about these standards by reading the brief description and table found here: https://www.epa.gov/criteria-air-pollutants/naaqs-table
According to the above article, the highest primary level each state has agreed its PM2.5 mean should not exceed is found in the table below. You will use this to state the null hypothesis.
Using the data found in the Excel file below, each of you are to select a state and test the claim that your state is meeting the Clean Air Act's primary level yearly maximum value. To help, I have included an example report for the District of Columbia that you can use as a guide. However, this is only a guide. You should not simply copy and paste my own words back to me. You need to explain everything in your own words and for yourself. If you copy and paste anything of mine word for word, that is considered plagiarism and you will receive an automatic "0" on the assignment.
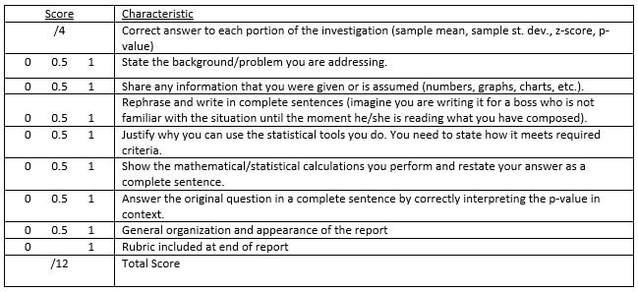
At the bottom of your TYPED report, you should copy and paste the following rubric that will be used to assess your report.
Please see me before this is due if you have any questions. After it is due, it is too late.
This will be scored as quiz points, so not homework points.
Steps (Day 1): Complete your mathematical calculations
1. Choose your state (see me to verify no one else has chosen this state).
2. Compute the average monthly PM2.5 values and standard deviation for your state over the 48 months.
3. Use your values to compute the z-score for your state compared to the standard 12.0 micrograms per cubic meter set by the EPA.
4. Use your z-score to compute the associated p-value for this right-tailed test.
Steps (Day 2): Type up your report
1. Read my example report for Washington D.C. below.
2. Type up your own report using the work you completed on Day 1. *See the note below about inserting equations in your report through Microsoft Word.
3. Make sure to include the rubric at the end of your report.
4. Print out your report to turn in.
https://www.epa.gov/pm-pollution/particulate-matter-pm-basics
I have used the Center for Disease Control's database to collect the average monthly PM2.5 level for each state from 2008 - 2011 (so, 48 months). Each of you are to choose a state and conduct a hypothesis test on the state's claim that they are meeting the Clean Air Act from 1990, which requires the EPA to set National Ambient Air Quality Standards for pollutants considered harmful to public health and the environment. Inform yourself about these standards by reading the brief description and table found here: https://www.epa.gov/criteria-air-pollutants/naaqs-table
According to the above article, the highest primary level each state has agreed its PM2.5 mean should not exceed is found in the table below. You will use this to state the null hypothesis.
Using the data found in the Excel file below, each of you are to select a state and test the claim that your state is meeting the Clean Air Act's primary level yearly maximum value. To help, I have included an example report for the District of Columbia that you can use as a guide. However, this is only a guide. You should not simply copy and paste my own words back to me. You need to explain everything in your own words and for yourself. If you copy and paste anything of mine word for word, that is considered plagiarism and you will receive an automatic "0" on the assignment.
At the bottom of your TYPED report, you should copy and paste the following rubric that will be used to assess your report.
Please see me before this is due if you have any questions. After it is due, it is too late.
This will be scored as quiz points, so not homework points.
Steps (Day 1): Complete your mathematical calculations
1. Choose your state (see me to verify no one else has chosen this state).
2. Compute the average monthly PM2.5 values and standard deviation for your state over the 48 months.
3. Use your values to compute the z-score for your state compared to the standard 12.0 micrograms per cubic meter set by the EPA.
4. Use your z-score to compute the associated p-value for this right-tailed test.
Steps (Day 2): Type up your report
1. Read my example report for Washington D.C. below.
2. Type up your own report using the work you completed on Day 1. *See the note below about inserting equations in your report through Microsoft Word.
3. Make sure to include the rubric at the end of your report.
4. Print out your report to turn in.
| PM2.5 Air Pollution Data.xlsx |
| example_investigation_into_state_claims_regarding_air_pollution_regulations.pdf |
In typing your report, you will notice that at some point you will need to use the Equation Editor in Microsoft Word (this is not avaiable in Office 365, so you will need to use a computer at home or in the library). To access this feature, go to Insert -> Symbols -> Equation. See below or come ask me for help.
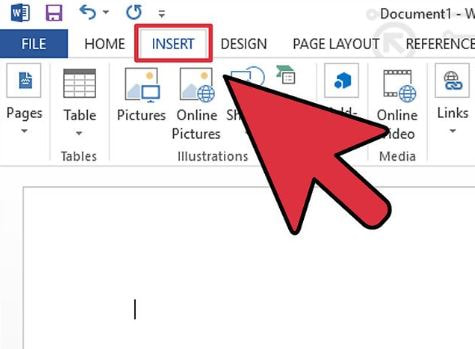
Step 1
|
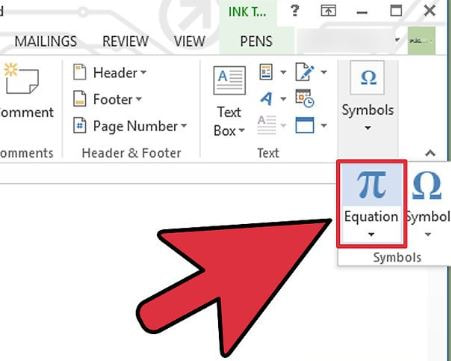
Step 2
|
Reading on the History of Probability and Statistics from the Book "Is God a Mathematician?"
Read the chapter provided in the PDF below and answer the questions on a separate piece of paper as you read. We will grade your answers in class before going into a group discussion about the reading.
Questions that go along with the reading from “Is God a Mathematician?” (pages 124-149)
Questions that go along with the reading from “Is God a Mathematician?” (pages 124-149)
- Who was the first person to work with statistics and what was his day job?
- What discovery did he make concerning the birth rates of males to females?
- These life tables were particularly interesting to what field? Why?
- Using the life table and the examples provided in the chapter, determine the probability that someone alive at age 50 will also be alive at age 80.
- Use your answer from question 4 to answer, “If you are 50 years old in Halley’s time and want to purchase a $20,000 life insurance policy in the case you die before reaching 80, what is the minimum amount you can expect to pay?”
- Describe Edmond Halley’s passage on page 131 in your own words.
- Adolphe Quetelet collected an inordinate amount of data concerning human characteristics. He then plotted the data by frequency and found nearly all followed what shape?
- Provide an example of two items that would be correlated in such a way that their correlation coefficient would be -1.
- Gregor Mendel found that the laws of probability apply not only to casino and gambling games, but to which other field?
- The Mendel exercise of cross-pollinating yellow and green allele plants had the exact same results as what?
- In figure 36, what is different between curve (a) and curve (c) and what causes this?
- The importance of probability and statistics is given by an account from George Shaw where he describes a conversation between what two types of men and their natural discovery of what common day concept?
| is_god_a_mathematician_probability_and_stats_chapter.pdf |
END OF COURSE SURVEY
Please take a minute to fill out this survey so the course can be improved for future students. Thank you!
SURVEY
SURVEY
